Lists
- create lists
- concatenating lists
- edit lists using list methods (e.g.
pop(),append(),insert(), etc.) - determine list length (i.e., how many elements are in a list)
- access items in a list using indexes
- storing items in a list in a variable
- creating a slice of a list
- converting a string into a list using
.split() - the difference between a tuple and a list
Files
- open a file to read or write from it (and close it when finished)
- read a file one line at a time with a for loop or
.readline() - write to a file
- use the newline character,
"\n", correctly - read a csv file (and handling the header)
- edit a csv file
- create and writing a csv file
Dictionaries
- create an empty dictionary
- add a key-value pair to a dictionary
- modify the value in a key-value pair
- determine dictionary length (i.e., how many key-value pairs are in a dictionary)
- use dictionaries to analyze files
- retrieve all keys or values at one time
- retrieve keys or values one at a time
- retrieve all key-value pairs at once
- use dictionaries to solve data science problems
NumPy
- create an array from a list
- create an array from a range
- create a array of all zeros of any length
- create an array of random integers of any length
- access items in an array using indexes
- create multi-dimensional arrays
- modify the shape of multi-dimensional arrays
- make a slice of an array (1D and 2D)
- use broadcasting in arrays
Matplotlib
- create visualizations of data (e.g., line plots, histograms, and bar charts)
- edit the color, style, and shape of the visualizations
- add/edit the title, xlabel, ylabel, figure name, xticks, yticks, figure size
- display multiple visualizations on a single figure
- read data from a file and create a visualization of the data (or a subset of the data)
Pandas
- create dataframes from lists
- create dataframes from existing dataframes
- create dataframes from csv files (and edit column names)
- write a dataframe to a csv file
- sort dataframes by column
- make a slice of a dataframe
- use
.head()and.tail()correctly - use
.unique()correctly - access and edit data points using indexes and columns (and
dataframe.loc[]) - create visualizations of data in dataframes
Putting it all together
- Create Data (if it doesn’t already exist)
- Access Data (that has already been created)
- Manipulate or Munge Data (that has already been input)
- Analyze Data (that has already been munged)
- Present Data (to help people understand it)
Study Problems
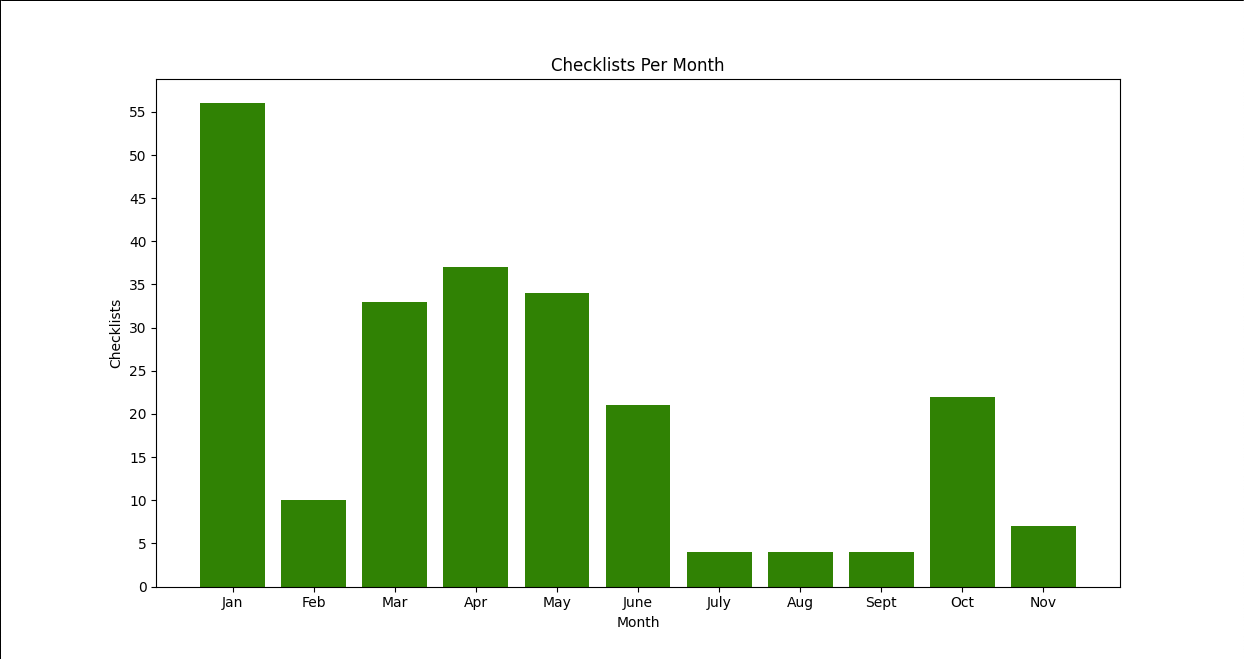
- Using data from ebird_year.csv, we can create a list of data that groups the total number of checklists submitted each month of 2022:
checklists_per_month = [('Jan', 56), ('Feb', 10), ('Mar', 33), ('Apr', 37), ('May', 34), ('June', 21), ('July', 4), ('Aug', 4), ('Sept', 4), ('Oct', 22), ('Nov', 7)]Use this list to create this bar chart:
